
 Image Description: On The Record 10-06-26. The Economy Is a Giant Zit. Lula In Trouble. Iran Escalation. Russia and the Plague. Theo and Zohran. UNFTR.
It starts as a little blemish. A teensy bit reddish and slightly raised. You scrub before bed hoping it goes away but when you wake up, there it is. No denying that round red bump with a yellowish hue at the tip. That’s the pus brimming below the surface. This is no mere pimple. It’s a full-on zit. And it’s ready to pop.
You disgusted yet? Great. Mission accomplished. Because that’s what this economy is right now. A big, giant, disgusting zit.
The administration is trying to pass it off as a beauty mark, but if you live in the real world, you know better. But to be fair, the administration had a leg to stand on last week because in the beginning it was one good report after another. A veritable winning streak. Until it wasn’t.
Construction beat estimates, as did private payrolls. These were legitimately good numbers for this era. Third-quarter GDP rebounded to 2.2%, a respectable increase from the prior quarters of 1.5% each. Inflation held steady on the Federal Reserve’s preferred measurement, PCE. Of course, they changed the methodology, so under the old metrics it would be higher, but who’s counting?! Since we’re past the days of real growth under every administration prior to this one, these are solid numbers. Even consumer spending blew away consensus estimates.
Then came the bad news, and it was unrelenting. What a week.
Personal income came in below inflation and half of what experts predicted. Consumer confidence also plummeted to the lowest non-COVID level in 12 years. Those two are certainly related—if your income is falling below inflation, you’re probably feeling a bit less confident.
Then the government’s nonfarm payroll numbers came in way below expectations with downward revisions for prior months. This all but blew up the whole “Fed can keep hiking because the labor market is fine” narrative.
The bifurcated news of last week reveals a confusing picture for officials who rely on data to make policy decisions. People are in more debt than ever, with wages growing below the rate of inflation, and static job growth still means that only 61% of Americans over the age of 16 are “attached” to the labor market. So how are there even positive signals coming from the economy?
Because it’s a zit.
Everything is concentrated in one area that’s about to burst. Consider the dynamics here for a moment. The vast majority of Americans are living paycheck to paycheck. The average employed worker is losing purchasing power every month. And yet, consumer spending jumped along with construction and GDP?
In reverse order because they’re all related. So let’s reverse-engineer them.
GDP growth is (still) related to AI investment activity and stock market gains. The AI investment activity is now centered around data center construction activities. (The construction growth is NOT in residential.)
-Oct-06-2026-04-52-38-7468-PM.png?width=700&height=419&name=unnamed%20(1)-Oct-06-2026-04-52-38-7468-PM.png)
Sources: Steve Rattner
The AI stocks continue to push the market forward (remember, these are backward-looking numbers), and the risk built up on the debt side of AI companies is pushing yields on fixed assets higher and higher.
Here’s how this all translates into more consumer spending.
Right now (and not for much longer), if you have a lot of money, you cannot lose. Private credit redemption requests might be through the roof, but those vehicles are still throwing off significant returns. (For now.) The biggest companies in the world have flooded the debt market with highly rated and well-paying corporate bonds. Giddyup. No shot Amazon defaults on its debt. (Oracle might, but that’s our next episode.) How about U.S. Treasuries for good measure? The yields on those fuckers go up every week. And not just the long-dated bonds. The 10-year is sitting at five and a quarter as of this writing. If that’s the worst-performing asset in a balanced portfolio, sign me up!
Based on fundamentals and logic, these things are all pus. As soon as the zit pops these vehicles will ooze out and eventually get wiped off.
Average Americans aren’t pushing real consumer spending (inflation-adjusted) higher. It’s the top 10% of Americans in the shareholder and investment class that are having a field day right now because, as I said, they cannot fucking lose.
So far.
The twisted part about the mainstream media obsession with stock market performance as an indicator of economic health is that it will take a severe reversal in equities for them to admit that we have a serious problem on our hands. But it’s almost as if no one wants to be the one to speak a downturn into existence. And I get it. Markets ride on narratives, so why not keep inflating the bubble for as long as possible?
So let’s talk about where the pressure is building. Because every zit has a head.
The biggest pressure on the U.S. economy right now is moving through the bond market. Inflation and oil are what pushed the Fed into its first rate hike in more than three years last month, but yields are the channel that carries all of that pain into everything else. The 10-year blew past its 2007 peak last week. That makes borrowing more expensive across the board—mortgages, car loans, corporate refinancing—and it presents an enormous threat to an economy that runs on credit.
And the pressure is coming from both ends. Long-term yields set the price of fixed-rate borrowing. But most of the private credit book is floating-rate debt tied to short-term rates, which are the ones the Fed controls directly. I’ve argued that the Fed has lost control of rates in this era of fiscal dominance, and on the long end that’s true. The Fed can’t talk the 10-year down while Washington keeps flooding the market with debt. But on the short end, the Fed still has its hand on the dial. And it just turned it the wrong way for every overleveraged middle-market borrower in America. (Trump wants 1%. He got a hike. More on that in a minute.)
If delinquencies turn into defaults and more “modifications” in the corporate debt market—be it public debt or private credit—a credit crisis could be brewing. Using its broad measure of borrower distress, Fitch put the private credit default rate at 6% for the 12 months through June. If corporate earnings begin to flag this earnings season, it could trigger a wave of liquidations with institutional money moving from equities to fixed income. Worse yet, these same institutions could run to cash. In practice that means money market funds parked in T-bills and repo. The money doesn’t vanish. It just stops flowing to anyone who actually needs it.
That’s a credit freeze. It forces the worst debt holdings underwater, which triggers a different kind of crisis. The kind that requires the Fed. That’s when the Fed’s other major responsibility comes back into the spotlight: backstopping liquidity in the credit markets.
During the shocks of the Global Financial Crisis and COVID, the Federal Reserve pumped historic liquidity into the financial system by buying Treasuries and mortgage-backed securities (MBS). Basically, it was a risk transfer. I’ll take your long-dated bonds and give you a mountain of cash in return. That way, when things get tight, the banking system has enough reserves to absorb losses without worrying about running out of cash.
Then the Fed spent years shrinking its balance sheet, letting bonds roll off without replacing them. That process ended last December. Since then the balance sheet has been growing again, but not the way it did in 2008 or 2020. The Fed hasn’t been buying MBS. It’s been loading up on short-term Treasury bills—“reserve management purchases” in Fed-speak—to make sure there’s enough cash in the banking system for the plumbing to work. (A chunk of those bill purchases is just the Fed reinvesting money from its shrinking MBS pile.)
It worked. Late last year the repo market, where banks and funds borrow overnight against their Treasuries, got ugly, and rates spiked. This summer, Treasury dumped roughly $400 billion in new bills into the market, and repo barely flinched. So in mid-August the Fed dialed its purchases down to zero. No visible liquidity strain in the marketplace. For now.
Here’s why this gets interesting.
Most of the conversation surrounding Kevin Warsh was the belief that he was on the same page as Donald Trump in bringing down interest rates. For good reason. He sounded like it in the interview phase for the job. That’s why Trump was sideways when Warsh joined a unanimous 12-0 vote to raise rates at the last meeting. Trump said rates “should be 1%, or less” and admitted he’d talked with Warsh about the vote ahead of time.
But his position on rates is far less interesting and meaningful than his stance on the size of the Fed’s balance sheet. Warsh has been saying the Fed should shrink it since at least 2011. It’s part of why he left the Board the first time. He hasn’t committed to a plan yet (his task forces report back early next year), but the idea he’s floated is a new accord that would give the Treasury more authority over any major adjustment to the Fed’s balance sheet. Remember that. It matters later.
To understand why, we have to revisit our work on the private credit markets for a moment.
Private credit is a market of more than $2 trillion globally, and it lives in middle-market lending—the companies too small or too risky for the public bond market. Traditional banks—the ones the Fed is concerned with—lend up-market, meaning large corporations and public companies with huge balance sheets, discernible cash flow, track records, and collateral.
But banks are exposed to the riskier and more rate-sensitive middle market anyway, because they lend to the very private credit firms that fund it. U.S. bank lending to nonbank financial firms jumped 28% last year to $1.4 trillion. And both private credit and traditional banks have enormous exposure to the circular AI debt financing fiasco that no one has yet put an official price tag to. That’s because so much of this debt is held “off-book” and moves through routes so circuitous that the lenders themselves might not fully grasp them.
So here’s what the unraveling could look like.
The Fed just hiked into a floating-rate private credit book. Every quarter rates stay high pushes more borrowers into paying interest with more debt, “amend-and-extend” deals, and eventually outright default. If the business development companies (BDCs) and private credit funds begin to struggle, the banks, which see these portfolios up close, start pulling back. They lower how much they’ll lend against the loans, tighten terms, and issue margin calls. Not only would there be a wave of selling in the finance sector, but tech would get hammered as well, because everyone knows how intertwined these positions are with the AI trade.
At this point we enter uncharted territory.
The playbook in 2008 and 2020 was for the Fed to take Treasuries and MBS off the system’s hands. But that was when rates were near zero. When yields rise, the bonds banks already own lose value. A 10-year at five and a quarter is a great deal if you’re buying today. It’s a disaster if you loaded up when it was paying 1.5%. That’s exactly what killed Silicon Valley Bank in 2023. And the Fed’s fix back then wasn’t to buy those bonds. It was to lend against them at full face value, as if they hadn’t lost a dime.
So in a free-fall environment like this, when government yields are high but everything else is dumping, the “safe” collateral on bank balance sheets is itself underwater. The rescue looks a lot more like 2023’s emergency lending than 2008’s bond buying. And it still swells the Fed’s balance sheet.
Then there’s the truly toxic stuff. The Fed can’t just absorb AI debt or private credit loans the way it absorbed MBS. To touch corporate credit, it needs emergency lending powers under the Federal Reserve Act, which require the Treasury secretary’s sign-off. In 2020, Treasury put up money to eat the first losses. Which means if the next crisis lives in a toxic stew of AI-related private credit, the bailout effectively nationalizes that risk. Washington takes the losses. Wall Street keeps the upside.
And that’s when we’ll see how deep Kevin Warsh’s commitment to reducing the Fed’s balance sheet really runs. But as a practical matter, the real responsibility for shoring up the financial system in the next crisis might actually belong to—I’m struggling to even write this—Scott Bessent over at Treasury.
In other words, god help us.
One Last Time for the Oracle of Omaha
Yes, earnings have been robust. Yes, the tech sector is exploding with investment cash into the AI trade. Yes, the market can theoretically move higher. But it’s also true that the stock market is wildly overvalued compared with historical trends. This is why we talked bubbles and zits in Max Notes. Methinks the equity ride is coming to an end soon.
Sources: MacroMicro
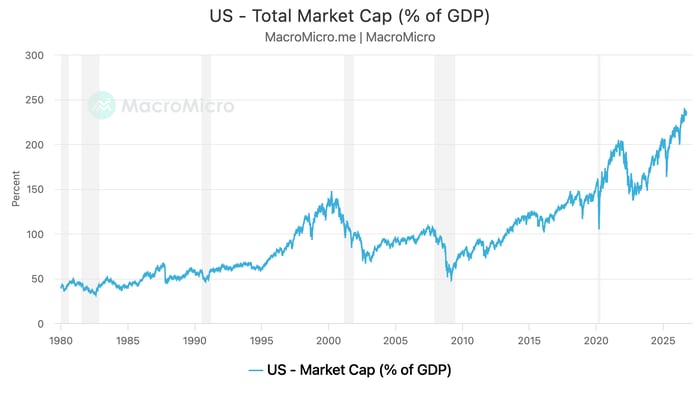
This is the total market cap of U.S. equities to GDP. Also known as the Buffett Indicator. It’s a loose guideline that Warren Buffett used throughout his career to evaluate equity cycles. When the market was below GDP, he believed there was healthy upside potential in value investments. When it was over 100%, it was time to be cautious and perhaps park some cash on the sidelines.
Welp, today it’s at 235%. No wonder he retired.
 Max
Max
Max is a political commentator and essayist who focuses on the intersection of American socioeconomic theory and politics in the modern era. He is the publisher of UNFTR Media and host of the popular Unf*cking the Republic® podcast and YouTube channel. Prior to founding UNFTR, Max spent fifteen years as a publisher and columnist in the alternative newsweekly industry and a decade in terrestrial radio. Max is also a regular contributor to the MeidasTouch Network where he covers the U.S. economy.