

Labor Daze.
Trump’s Resident Idiot Says the Economy is a Gift.
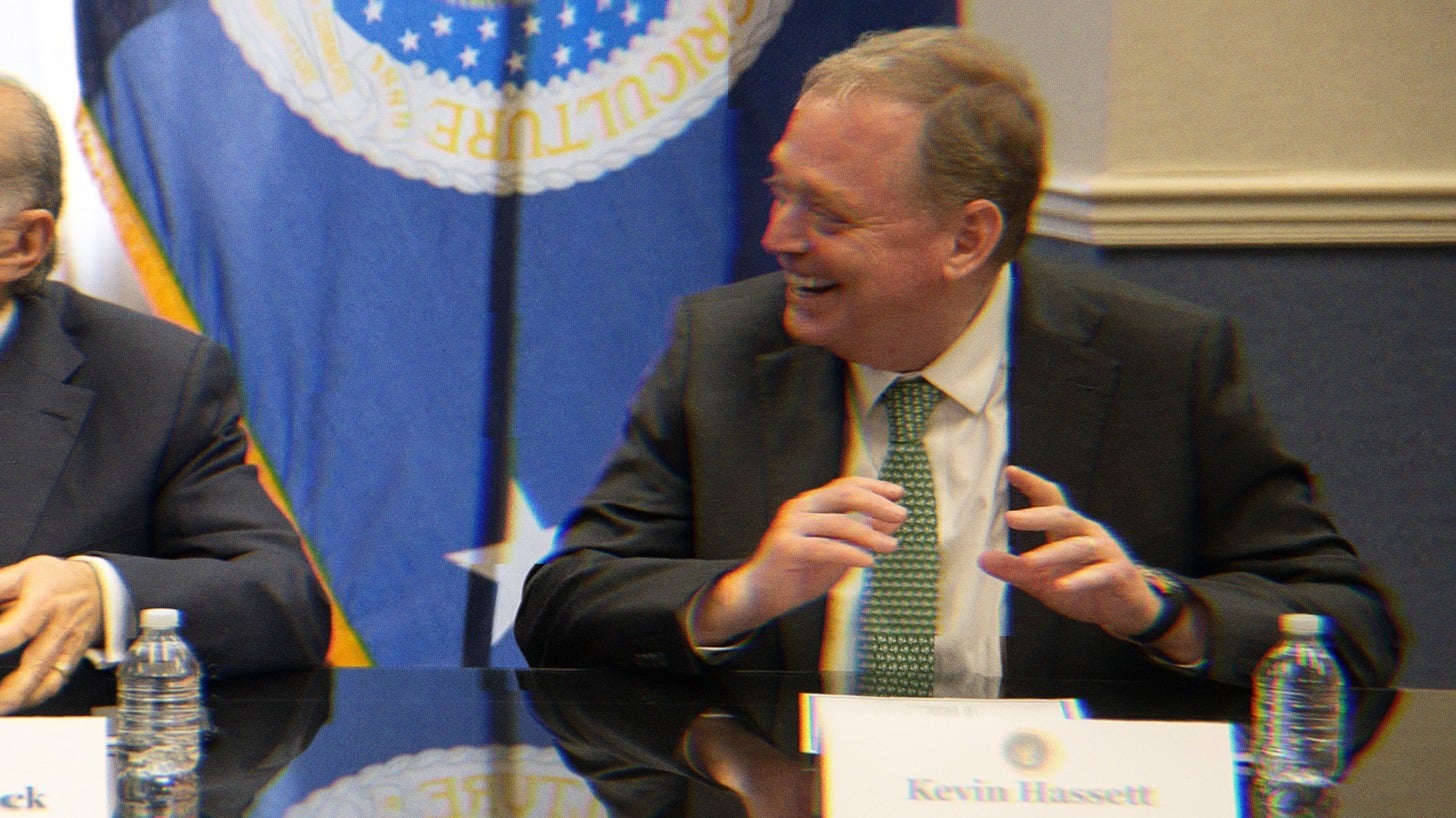 Image Description: Kevin Hassett in a meeting, laughing. His name placard is visible on the table in front of him.
Trump administration official Kevin Hassett declared the latest jobs report as a “present to the American people” for Labor Day. Really, Kevin? Let’s dig into this claim by looking closely at the labor data. What you’ll find is that more Americans than ever are dislocated from the full-time employment picture in this country, and that this administration has zero idea how to fix it. And they’re not even trying. But, sure. Happy Labor Day, America. Enjoy the weekend worrying about how to pay your bills.
Kevin Hassett, director of the National Economic Council, went on television before Labor Day weekend to declare that the recent jobs report was “a present to the American people” in time for the holiday.
Oh. Fuuuuck this guy. Seriously. A real-life example of “failing up,” Kevin Hassett has now served in both Trump administrations. His claim to fame from the first one was developing an economic model to project that COVID deaths would be zero by the summer of 2020. So accuracy isn’t exactly his specialty. At one point there was talk that he might even be tapped to run the Federal Reserve, but even Trump thought that was too funny for real life.
He characterized the jobs and inflation data as a gift, saying that inflation is low and that jobs were robust. For the life of me I cannot fathom how he arrived at that conclusion regarding inflation. But the August jobs report was one of the better ones and it included upward revisions for the two previous months as well.
Of course, in any other administration these numbers would have been considered anemic, but we’re in Trump’s fantasy land now. So allow me to give you another reading of the labor situation. In honor of the president’s so-called “gift” to Americans this Labor Day weekend, let’s do some manual labor to dig through this pile of utter horseshit.
The Ghost of Employment Past
It’s been exactly 50 years. July of 1976. That’s the last time that less than 61.4% of Americans worked. In July of ‘76 things were a lot different. This is called the labor participation rate which measures adults—nonstudents, nonmilitary service members—over the age of 16 who are “attached” to the labor market. And, yes, we’re going to tackle the word attached because it’s probably one of the most misleading caveats in the world.
The labor situation in this country is a fucking disaster and yet all the smoke in financial media is about inflation. So the Fed is looking to calm inflation as its primary target, at least that’s what Kevin Warsh recently indicated at Jackson Hole. Inflation and work are obviously related, of course, but my goodness can we get serious about work?
Is it possible to break away from this dual mandate paradigm that we’re trapped in?
The recent data releases are all over the map, which complicates the read on everything. The July nonfarm payroll report stunned everyone by showing a loss of 23,000 jobs. As of this report those figures have been revised higher, up to a gain of 21,000, with June bumped up to plus 31,000. Those are the government’s own figures derived from survey data.
We also have private payroll data from ADP that’s extremely uneven between industries and by company size. Healthcare is back up again, which makes sense given our aging population. Additionally, private construction jobs are up, but the public construction figures are down. So are these data centers being built or not? Manufacturing goes up and down like a yo-yo, but the longer trendline shows a sector that has been obliterated since NAFTA.
How can you be adding construction jobs without manufacturing more inputs and materials? And where does AI fit into all of this? More questions than answers as usual.
And here’s a category that trips people up every single cycle: local government education. You’ll see this line item swing by tens of thousands of jobs practically every month, and it looks alarming until you understand what it actually is. It’s not hiring booms and layoff busts. It’s school. It’s teachers and school administrators going back to work. July showed local government education down 50,000. August showed it up 42,000, almost entirely reversing that drop. That’s a significant portion of the numbers that Hassett is touting in the August release.
What Even Is “Work” These Days?
The idea that Reagan is responsible for the dual-income phenomenon in this country is firmly rooted on the left. On the right, the narrative is that feminism pushed women into the workplace so it was a choice, and that Reagan ushered in a wave of prosperity. The left believes that workers have been stuck in place for several decades while the right believes that we are better off today than everyone else in the world so, basically, shut the fuck up.
The real reason households had to carry two incomes is more tangible and pragmatic than that. And it started before Reagan. The reason a single income was no longer sufficient to support a U.S. household was due to the devaluation of the dollar and the advent of credit. And they’re inexorably connected.
By the 1960s, the 30-year mortgage was in widespread use across America. Thus began the slow and steady asset inflation of the housing market. Then Nixon broke the dollar peg to gold and we flooded the world with dollars. Those dollars were lit on fire due to the dual oil shocks of the 1970s, and for the first time since World War Two, people were having a tough time making things work. Everything was more expensive, jobs were hard to come by, and Reagan was about to alter the course of the U.S. economy for the next several decades.
By the time NAFTA was signed, the precarity of work due to multiyear wage suppression and asset inflation had already been chipping away at household savings and wealth. The offshoring of manufacturing jobs started slowly, but accelerated throughout the 2000s to the point where we have people like Kevin Hassett celebrating even a marginal uptick in numbers. But the proof is in the data: we now operate a service and financial economy and manufacturing is unlikely to return anytime soon, especially if we continue to hammer our trading partners with tariffs. That might sound illogical because the stated purpose of tariffs is to encourage domestic production, but the fact is the tariffs weren’t enacted within the context of a true industrial policy so all we’re doing is making raw materials and finished components more expensive for the producers who remain.
This is where the healthcare situation we covered in our last essay, Merchants of Death, comes into play. And it’s also where we can garner a little insight into the nature of employment in the United States.
One way to develop a baseline of true employment is to start with people who have benefits, because that’s actually one of the more solid data points we have. Roughly 165 million people under 65 had employer-sponsored insurance as of last year, according to KFF’s tracking of Census data—that’s about 60% of the nonelderly population. But, of those 165 million, only 85 million actually have that coverage through their own job. The other 79 million are riding on somebody else’s plan. Obviously this isn’t perfect. One person may work and cover another who also works full time. Or they might have a part-time job, gig work, freelance, or not work at all. So again, imperfect but a start.
Now here’s where it gets difficult, and I want to be fair, because this is just an extremely hard thing to measure, and every method we have is a survey, which means every method has both a lag and a blind spot. The Current Population Survey—the household survey that gives us the unemployment rate every month—asks about one reference week. If you didn’t have a job or weren’t looking for one during that specific week, you fall into a bucket, and which bucket you fall into determines whether you show up in the number at all.
Here’s the hierarchy: you’re either employed, or you’re unemployed—meaning no job, but you actively looked for one in the last four weeks and you’re available to start. If you didn’t look in the last four weeks but you did look sometime in the past year and you’d take a job if offered, you’re “marginally attached.” That’s not unemployed. That’s a separate, smaller, less-discussed pile. Within that pile, if the reason you stopped looking is specifically that you don’t think there’s a job out there for you, you’re a “discouraged worker”—a subset of a subset.
So as of the July report, marginally attached people numbered 1.8 million, and of those, only 476,000 were classified as officially discouraged. Then there are people employed part time “for economic reasons,” meaning they want full-time work, couldn’t get it, and are stuck with fewer hours than they need, and there are 4.8 million people in that bucket.
We have a measurement for this. It’s called U-6. The one you hear most often is the U-3, which is currently around 4.1%. But U-6 is supposedly the “real” unemployment rate because it folds in the officially unemployed, the marginally attached, and the involuntary part-timers all into one number. And even U-6, sitting around 7.7–7.9% depending on the month, still doesn’t capture everyone, because it still requires you to have looked for work within the last 12 months. If you gave up entirely, more than a year ago, you don’t exist in any of these categories. You’re just gone from the math.
And this is where “attached” is a funky word. The entire architecture of this data rests on whether you are “attached to the labor force.” A retired 58-year-old who’d take the right job tomorrow if it appeared isn’t attached. A mother who stopped looking eight months ago because she can’t find child care that costs less than the job pays isn’t attached. Someone who’s been turned down 40 times and finally stopped applying isn’t attached. None of them are unemployed, by the government’s definition. They’re simply invisible.
Now overlay gig work onto this. The BLS itself will tell you, in its own FAQ: “BLS does not have a definition of the gig economy or gig workers.” BLS has proposed to fix part of the data collection issue but it was only proposed this past February, which means we are still operating on a measurement system that cannot tell you how many people are driving for Uber on the weekend to cover their mortgage, and absolutely cannot tell you how many people are doing that on top of a full-time W-2 job.
To be clear, none of this is a knock on the people trying to measure it. This is legitimately hard. You cannot build a real-time, granular map of 170 million people’s economic lives off a monthly phone survey of 60,000 households, and every other data source we have—JOLTS, ADP, all of it—comes with its own lag and certain caveats.
But let’s go back to our starting point: 85 million people covered by insurance through their own job. That’s a real, if imperfect, floor for “people gainfully employed with benefits” in this country. Add the tens of millions more who are working—full time, part time, gig, some combination—but are covered under a spouse’s or parent’s plan instead of their own, and you’re already well past that number without anyone showing up twice; the prototypical double-income household that Reagan is crediting for necessitating.
Now start layering in every version of “not quite attached” we just walked through, and you can watch the picture degrade in real time. This is why the same jobs report can produce a stronger number and a weaker number simultaneously and both can be true.
And the benefits piece matters here beyond just counting bodies, because prime-age labor force participation—the 25-to-54 cohort that the Fed and every economist treats as the one segment that really matters—is also the cohort absorbing the healthcare cost increases we’ve been covering all year. Doesn’t matter whether they’re on an employer plan or an ACA exchange plan: employer premiums are projected to climb another 6.7% this year, the steepest rise in 15 years, pushing average per-employee cost above $18,500, with more than half of employers now cutting benefits to soften the blow to their own budgets.
ACA marketplace premiums, for people who don’t have that employer option, are up an average of roughly 20–26% this year alone, on the heels of the enhanced subsidy expiration we covered in the Merchants of Death episode. So even the workers who are considered the healthy core of the labor force are absorbing a second form of wage erosion.
The Fractured Labor Market
If we strip away the methodological discussions, what’s left is a structural issue that no one can seem to agree upon. Why is labor participation in freefall?
Is it demographics? Baby boomers retiring at a clip that’s outpacing the roughly 0.2% annual drag economists expect from aging alone, maybe accelerated by two years of a stock market up over 35%—because if your 401(k) did that well, why keep grinding?
Is it immigration? Foreign-born workers participate at around 66% versus roughly 61% for native-born workers, and this administration’s enforcement posture means fewer of those higher-participation workers are in the count at all, whether they left the country or just the labor force?
Is it seasonality? A purely statistical wrinkle in how the survey adjusts for the school calendar and summer youth employment that tends to unwind itself by year’s end?
Or is it just a soft labor market? The honest answer is probably some combination of all four. What we do know is this: this administration has made a policy choice to restrict the flow of immigrant labor into this country, and whatever your position on immigration policy itself, that choice mechanically shrinks the pool of higher-participation workers feeding the labor force. That’s a predictable consequence of a decision that was made.
The media, for their part, are soft-pedaling all of this by calling it a “low-hire, low-fire” environment—employers aren’t laying people off in a wave, but they aren’t hiring either, so the topline numbers stay calm while almost nobody underneath them is actually moving. Ask yourself what that phrase is actually describing: an economy where employers have enough uncertainty, or enough cost pressure, or enough automation on the horizon, that the safest move is to freeze. Some might call this stability. Or, this is complete paralysis.
One thing’s for sure, it’s why the only thing financial media wants to talk about is data centers and AI capital expenditure—because that’s the only spot with real action.
What’s left, according to both the private ADP numbers and the government’s own release this cycle? The biggest gains keep landing in food and beverage service and healthcare. I’m not demeaning either of those sectors—a nurse and a line cook are real jobs doing real work, and yes, they contribute to GDP like anything else.
But let’s be honest about what they are not: they are not the kind of broad-based, capital-intensive, wage-lifting industrial activity that actually signals an economy building durable capacity. They’re the two sectors propping up nearly the entire headline that Kevin Hassett was celebrating. That and a 0.2% uptick in participation to bring us back to when Rocky and Taxi Driver were in the theaters.
What’s most insulting to me about someone like Hassett spiking the ball over objectively shitty data is that it ignores the loss of purchasing power. That, and the fact that they don’t care enough to even have a plan. The course we’re on is the one we got. And that genuinely blows. But Happy Labor Day America, and you’re welcome for Trump’s fabulous gift, you ungrateful swines.
Image Source
- USDAgov, Public domain, via Wikimedia Commons. Changes were made.
 Max
Max
Max is a political commentator and essayist who focuses on the intersection of American socioeconomic theory and politics in the modern era. He is the publisher of UNFTR Media and host of the popular Unf*cking the Republic® podcast and YouTube channel. Prior to founding UNFTR, Max spent fifteen years as a publisher and columnist in the alternative newsweekly industry and a decade in terrestrial radio. Max is also a regular contributor to the MeidasTouch Network where he covers the U.S. economy.