 Image Description: Hundred dollar bills burning at the edges.
Heading into the inflation print this week, Federal Reserve Governor Christopher Waller, a relatively conservative member of the Fed board—and one of the few people offering any insight into Fed thinking now that we’re in the Warsh era of zero guidance—said that if core inflation came in at 0.3% or higher again, a 50 basis point hike should be considered at the December meeting. In his words, “Hiking only 25 basis points would put our credibility at risk, a risk I am not eager to take.”
I’m not going to get into the weeds with Fed policy today. It’s a distraction from the mission at hand. But it’s worth mentioning, because the real policymakers in this country, like Waller, understand that inflation is a huge issue for consumers. And understand the implication behind such a forceful statement. He, and we can assume his colleagues, believes the labor market can take the hit. Otherwise he wouldn’t use such aggressive language. His own words: the U.S. economy “is growing strongly,” and the labor market is “stable.” Again, this illustrates the widespread belief that the economy is strong.
This is the neoclassical prism through which decisions are made. There’s a generation of policymakers that still hold this isolated view of the world. If inflation runs hot, it must be cooled by destroying the economy. If unemployment runs high, we have to encourage everyone to borrow money and spend it by bringing down interest rates. I want to move past this narrow view.
Because, as it turns out, we got the numbers Waller feared. Core prices rose 0.3% for the third month in a row, right at his trigger, and the headline number rose 0.4% after 0.6% in September. UNFTR viewers won’t be surprised, because a couple of months ago we covered the producer price index (PPI) numbers that were off the charts. The PPI is the leading indicator that shows inflation baked into the wholesale sector, so let’s just say I am Jack’s complete lack of surprise.
Now for the confusing part before I show you some graphs that will absolutely resonate with your own personal experience. The confusing part is the nature of this inflation print. Not only are goods prices increasing, but so are services. So it’s not just fuel, fertilizer, raw materials and tariffs. In October alone, hospital services rose 0.8%. Recreation services, 0.9%. Car insurance, 0.7%. Sit-down restaurant meals, 0.7%. And Waller noted that more than 70% of the service categories in the Fed’s preferred inflation measure were running above 3% a year.
Part of that reflects tech cost inputs, certainly, but that doesn’t explain all of it. Or does it? Maybe partially. Some of these services lean toward the upper end of the consumer wealth spectrum, so it’s an example of “greedflation,” yes, but it’s also downstream inflation. The barber and the massage therapist have rent to pay and gas to put in their cars too. Both are examples of what economists would consider a strong economy, though. As long as these things are going on—doctor visits, concerts, dinners out, physical therapy—it’s considered a strong economy, no matter how much or how little you have left in the bank.
So this report puts us on pace for roughly 4% inflation for the year. Through October, prices in 2026 are rising at about a 4.2% annual rate. That’s above wage gains, double the Fed’s target, and above where Biden left off, which was about 3% in January 2025. It’s just a bad number no matter how you slice it. And yet the strong-economy narrative persists because of the longer trendline of wages outpacing inflation. So let’s really look at the numbers and try to make sense of it all.
Two Truths and a Lie
Let’s start where the economists start. Consumer prices against median weekly pay for full-time workers, going back to the start of 2008. Since then, prices are up about 57%. Pay is up about 74%. The typical full-time worker can buy about 10% more than in 2008. Strong economy, case closed.
But this chart hides its own history. The monthly report tells you how fast prices are moving now. This chart tells you the score after 18 years. I purposely started with 2008, because in my mind that’s the moment of the great reset for the American consumer. Anyhow, both can be true, and that’s where the confusion comes from.
So where did that gap come from? Mostly from the decade after the financial crisis.
From 2008 to the end of 2019, inflation was low and pay beat it by about 8%. It was a painful recovery, but it was a recovery. Then there’s the spike in 2020. Millions of lower-paid workers lost their jobs, and when the bottom of the sample disappears, the median goes up. Nobody got richer. The people at the bottom just stopped being counted. It’s stunning to me how many analyses omit this piece. That’s the lie if you were wondering. Everyone was not okay. The chasm that opened up between the upper and lower ends of the economic spectrum meant that for millions of Americans the Great Recession never ended.
So let’s reset the clock to the end of 2019. This is pay adjusted for inflation.
Zero is where purchasing power stood in late 2019. That big hump in 2020 is the layoff distortion. Now watch 2021 and 2022. The inflation surge wipes it out, and by the middle of 2022 real pay is below where it started. From 2023 on, inflation cools and pay climbs back to about 4% above the line. And now, in 2026, it’s sliding again.
Today the cushion is somewhere between 2.3% and 2.5%. Seven years of progress. And the pace has flipped. In the latest quarter, median weekly pay was up 2.8% from a year earlier, while prices were up 4.2%. Average hourly pay, the steadier monthly measure, has trailed inflation every month since April. If that pace holds, the post-pandemic cushion is gone in under two years.
Remember Waller calling the labor market stable? In that same speech: “if your mom was in the hospital and the doctor told you her condition was stable, you would be relieved but you wouldn’t say she is healthy.” More than 27% of the unemployed have been out of work over six months, and paychecks are falling behind again. That’s the patient.
CPI Is Only Part of the Story
This is where it gets personal. CPI is the average price of a basket, and the things eating households alive aren’t fully in that basket.
First, the two lines from before: CPI and pay. Rent is also in CPI, and it’s up 87% since 2008, outrunning both prices and pay. The average new-car loan is up about 66%, faster than inflation but a little slower than pay, and used-car prices actually fell in October. Now home prices: up about 94%. And finally, the line that should end every “strong economy” argument. The monthly mortgage payment on a typical home is up about 112%.
And CPI doesn’t count home prices at all. The government treats a house as an investment, so instead of what you pay for a home, CPI uses an estimate of what homeowners would pay to rent their own house. That estimate makes up about a quarter of the entire index. Mortgage payments aren’t in there either. So the biggest purchase most families ever make and the monthly bill that comes with it sit outside the number the Fed is targeting.
And 2008 flatters the picture, since home prices were coming off the bubble. Start the clock at the end of 2019 and the typical mortgage payment is up about 119%, while median pay is up about 33%. That’s the insult added to injury. Your paycheck is roughly keeping up with the basket. It isn’t remotely keeping up with the roof over your head.
So how have people been keeping up?
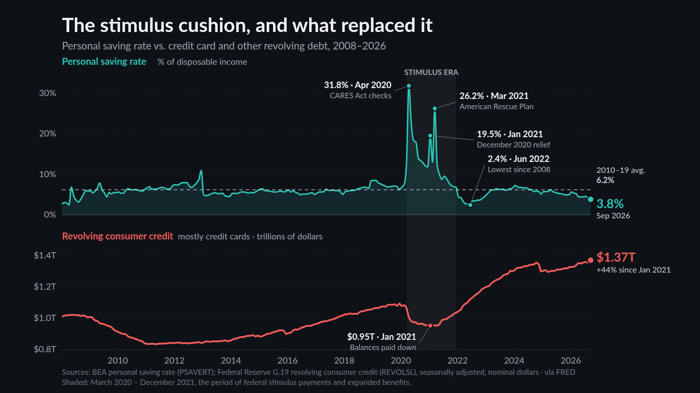
Sources: BEA + St. Louis Fed
On top is the personal saving rate—the share of after-tax income households set aside. On the bottom, revolving credit, which is mostly credit cards.
For a decade the saving rate sat around 6%. Then the stimulus hit. The CARES Act checks pushed it to almost 32% in April 2020. December 2020 relief, another spike. The American Rescue Plan in March 2021, another one, 26%. Card balances fell to about $950 billion by January 2021.
Then inflation and corporate “greedflation” went to work on the consumer. By June 2022 the saving rate had crashed to 2.4%, the lowest since 2008. Back to the beginning again. Today it’s 3.8%, still well below its pre-pandemic norm. And card balances are at $1.37 trillion, up 44% from the stimulus low.
Consumer spending is the engine economists point to when they call the economy strong, and spending kept going. It just got paid for, first with stimulus savings and then with credit cards. Even Waller said he expects spending to slow “to levels that I think are more consistent with household income and wealth.” Translation: people have been spending faster than their paychecks can support.
So are the economists wrong? No. Unemployment is 4.1%, and over 18 years the paycheck beat the basket. Of course, this doesn’t account for the labor participation rate, which remains at 50-year low, but we’ve covered that ad nauseam. Are the voters wrong? Absolutely not. The cushion since 2019 is nearly gone, housing costs have doubled relative to pay, the savings are spent, and the credit cards are carrying the load. The economists are reading the economy’s income statement. Voters are living the household balance sheet.
So where does this go? Democrats take over Congress in January with the largest House majority since 2008, but there’s an obstructionist veto pen in the White House, and the president has already signaled he’s ready to use it. Meaningful change through legislation is going to be extremely difficult for the next two years.
Meanwhile, the Iran war did structural damage to the global economy and the supply chain that won’t heal quickly. Recovery is a couple of years away at best.
My expectation is that demand destruction kicks in long before policy does. When people can’t borrow any more, they stop buying, and that’s what will cool asset inflation and some core goods and services inflation. And hanging over all of it is the threat of a complete AI collapse that could drag multiple sectors down with it.
In no way, shape or form does the Federal Reserve have the ability to manage a recession, or demand destruction that leads to something worse, with its standard toolkit. Raising rates on a tapped-out consumer doesn’t fix a supply chain. My guess is they’ll have to invent new names and new methods for quantitative easing to backstop liquidity along the way.
So the real question is political. Do Democrats have the fortitude and cohesion to build a sustainable, long-term roadmap for taking power in 2028 and beyond? There’s a good chance they’ll be walking into an Obama-level mandate to restore the economy, and no amount of tinkering will be sufficient. Because as these charts illustrate clearly, the consumer is against the wall for a host of reasons, not just whether a haircut or a loaf of bread costs twice as much as it used to.
 Max
Max is a political commentator and essayist who focuses on the intersection of American socioeconomic theory and politics in the modern era. He is the publisher of UNFTR Media and host of the popular Unf*cking the Republic® podcast and YouTube channel. Prior to founding UNFTR, Max spent fifteen years as a publisher and columnist in the alternative newsweekly industry and a decade in terrestrial radio. Max is also a regular contributor to the MeidasTouch Network where he covers the U.S. economy.